Data desk
The EPO is a data-driven organisation. Data is essential for informed policy-making, forecasts, business decisions and a host of other uses. Good presentation and interpretation of data is critical if meaningful conclusions are to be drawn.
The activities of patent applicants, as revealed through their applications to the EPO, tell us a great deal about technology developments and their own commercial priorities. With about 200 000 applications filed at the EPO each year, and several million more published globally, these provide a wealth of data to be explored and sorted, and from which valuable insights can be drawn. When this patent-related data on technology trends is cross-referenced with economic data curated by other organisations, a rich context is revealed, providing insights into innovation in particular sectors, countries or regions. When a surge in academic research publications is linked to a corresponding rise in patent applications, emerging technologies can be detected years before market entry. Such insights are only possible when we combine EPO patent information with data arising from other actors in the innovation ecosystem. How this data is visualised, using charts, tables and dashboards, is of critical importance to interpreting and understanding it. Relevant conclusions can only be drawn from data when it is presented so as to convey meaning.
Such data tools will enable:
- the monitoring of the way in which different categories of entities and industries make use of the patent system, both at the European and the international level
- the monitoring of innovation trends, spanning emerging technologies as well as ongoing technology transformation in broader industry sectors
- the analysis of the activities, economic potential and actual impact of innovation ecosystems
These new dashboards, tools and data presentations will be developed as part of the ongoing tasks of the Observatory. Those currently available from the EPO include:
- Deep Tech Finder
-

Our latest tool is our Deep Tech Finder. It blends data from Dealroom on thousands of startups seeking funding with the information on their respective patent portfolios as visible in the EPO’s public patent databases. Now, just by browsing a map, it is easy to find dynamic deep tech companies active in selected digital or clean energy technologies anywhere in Europe, and also to check what funding they already have as well as the status of their patent application(s). See our demonstration video (08:30 mins)
- Patent Index and the Statistics and trends centre (STC)
-
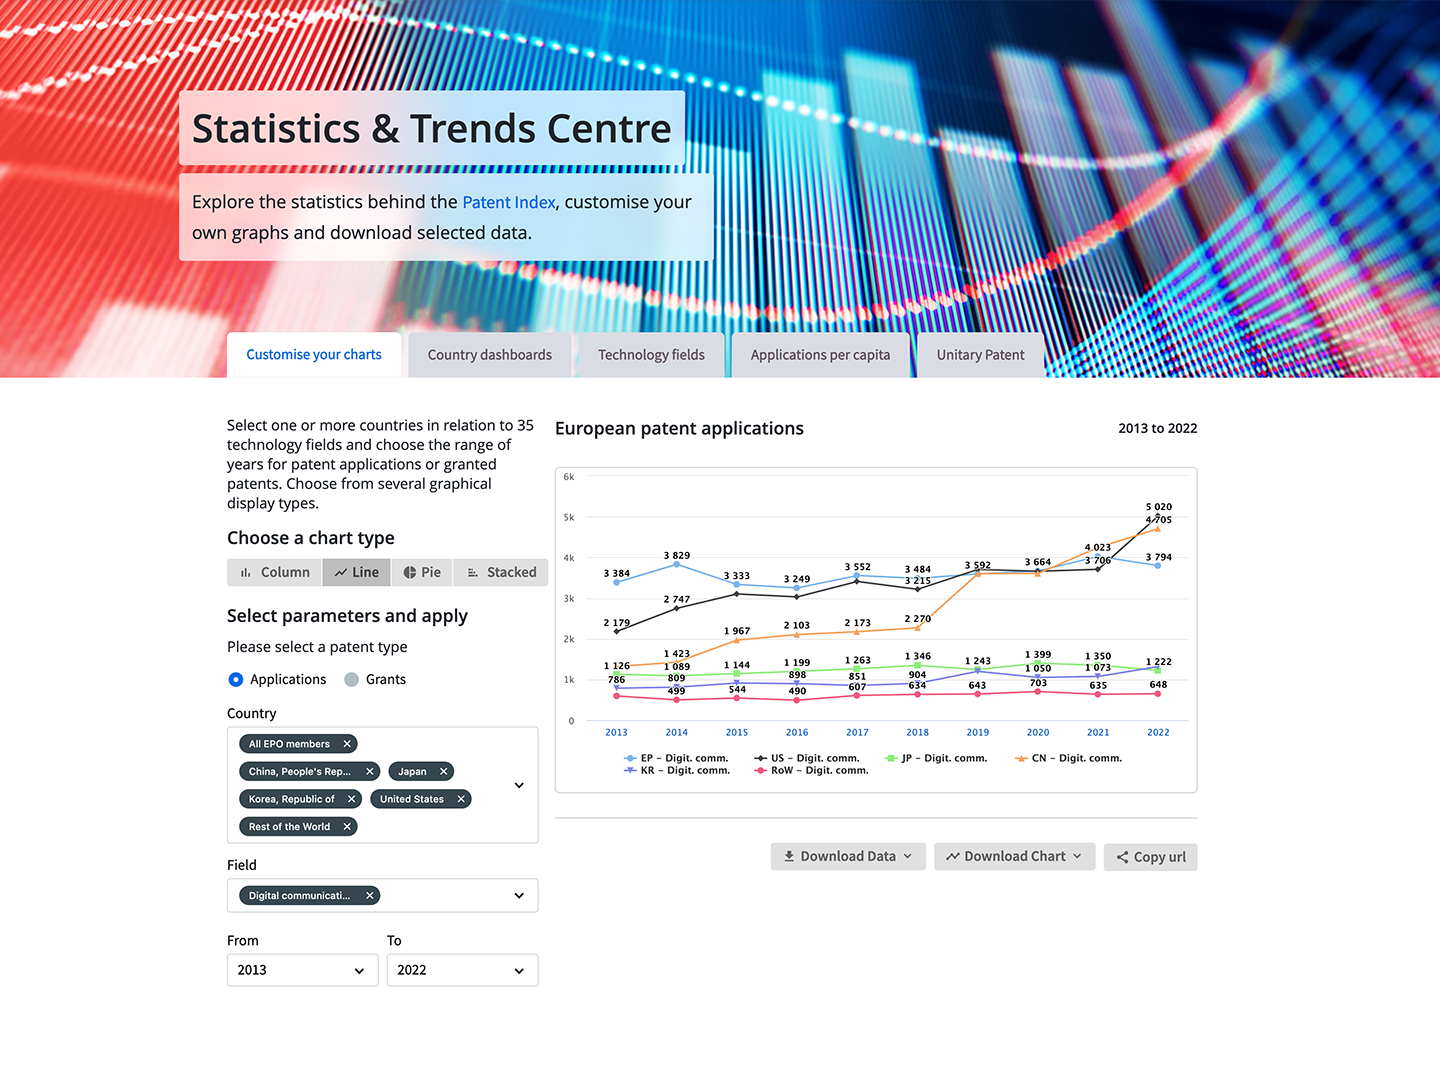
Our annual Patent Index gives a comprehensive overview of EPO filing trends for the previous year, reporting on the latest applications a year or more in advance of them being published and appearing in any other database to be analysed (e.g. in PATSTAT). The Patent Index shows only a curated portion of the total amount of data related to our annual filings and grants. The full picture can be found in the Excel sheets we publish for you to explore for yourself. These are also the data source behind the Statistics and trends centre, which lets you select and compare datasets and display these in a variety of chart formats.
- Unitary Patent dashboard
-

We also publish daily updates on the status of requests for unitary effect on recently granted European patents. Our Unitary Patent dashboard shows requests and registrations according to the patent owners’ location, the related technologies of the patents and the languages in which the patents were processed and subsequently translated.
- Technology platforms (running in Espacenet)
-
The EPO also provides several technology platforms which make it easier for scientists and researchers to explore our free patent database, Espacenet. These platforms put the considerable knowledge and experience of EPO patent examiners at the service of the public –they have used their skills to create expert patent search strategies that can be run on Espacenet to recover all relevant documents for hundreds of different technologies. Our first four platforms relate to:
- technologies combatting cancer - over 130 search strategies covering prevention and early detection, diagnostics, therapies and wellbeing and aftercare
- firefighting technologies – over 30 search strategies, from fire detection to prevention and extinguishing
- clean energy technologies – over 60 search strategies for wind, solar, hydroelectric and geothermal inventions, as all as means to distribute and store renewable energy
- fighting coronavirus – over 350 search strategies covering everything from vaccines to therapies, diagnostics and bioinformatics, and even tools, masks and furniture adapted to reduce the spread of the disease

Contact us
If you have questions or would like to contribute to our work, we would be pleased to hear from you:
observatory@epo.org