Assessing the life cycle of technologies
Technology maturity map shows number of patents and applicants over time
Successful technologies typically evolve through a number of phases, from a slow start to an acceleration phase followed by a maturation phase and finally a stagnation phase, when other technologies take over. But how can we assess these phases of development?
The recently published patent insight report on Offshore wind energy features a maturity map showing the development over time of a technology by comparing the number of international patent families (IPFs) with the number of applicants.
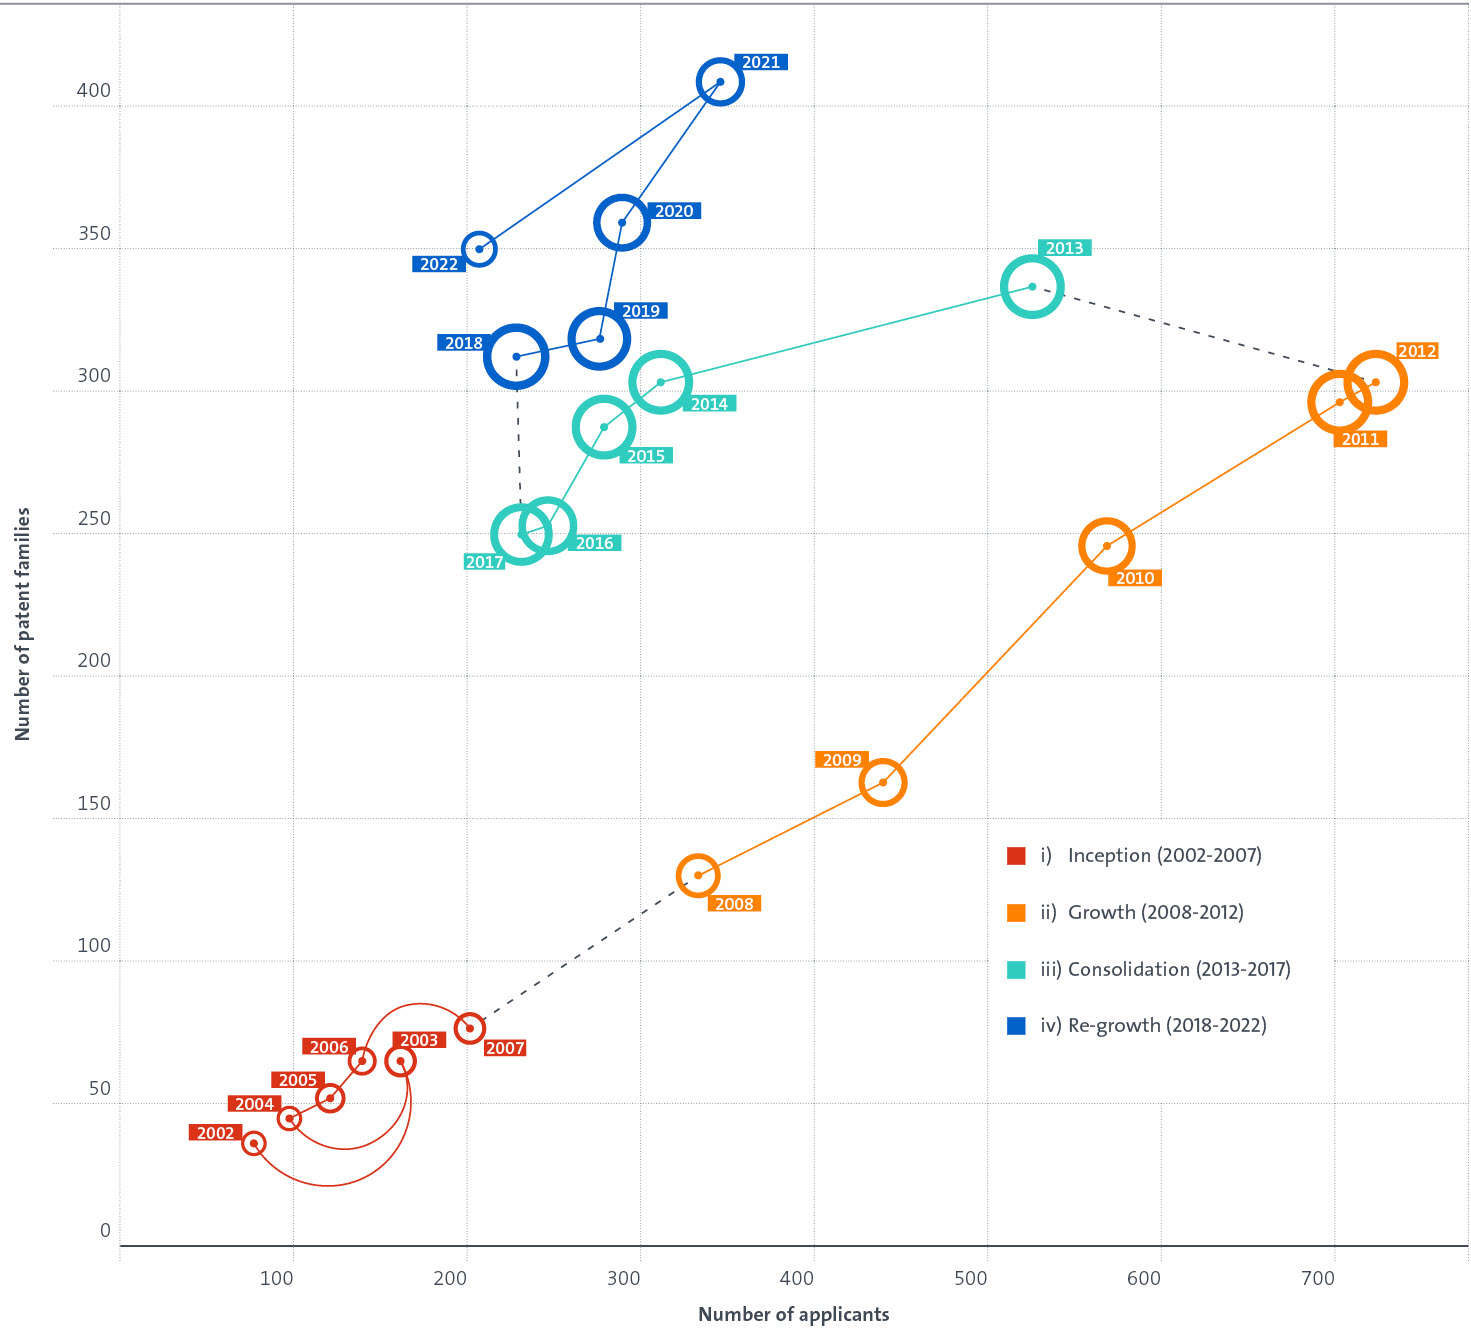
Fig. 1: Maturity map of offshore wind energy patent applications (2002-2022)
In the graph, we used varying bubble sizes to codify the number of patents that were published in the respective years and granted in the meantime, which may indicate patent quality.
In the development of offshore wind energy technologies, four distinct phases can be identified:
- The inception phase considers the initial years (2002-2007) analysed in the report and shows a limited number of granted patents with a few distinct applicants active in this area.
- The growth phase (2008-2012) shows a rapid increase in all the three dimensions of the maturity map: international patent families (marked by increasing Y-axis values), number of applicants (marked by increasing X-axis values) and number of granted patents (marked by increasing bubble size).
- The consolidation phase (2013-2017) starts with a significant decrease in the number of applicants – mostly individual inventors - and the decrease in IPFs follows with a certain time delay. Interestingly, the consolidation of applicants did not have a significant impact on the grant rate when comparing, for example, the numbers for 2011 and 2015. This may be an indication that the quality of the inventions was maintained.
- The time from 2018 to 2022 saw an average renewed growth in terms of IPFs and applicants, while less for granted patents. However, the grant rate in this period may still improve due to the higher percentage of pending procedures.
When applying this approach to other datasets, the following tips may be helpful.
Distinct counting of the patents should be done on a family level rather than on number of patent applications or publications in order to be sure that an invention is only counted once. We additionally use the concept of the international patent family (IPF), taking into account the countries of the applicants and the filings at different patent offices. This concept is used to filter those families where applicants wish to file internationally rather than seek protection only in their domestic market. Patent filings at the EPO, WIPO or any of the other regional patent offices are by default IPFs, since they may cover many countries. The number of applicants can only be meaningfully determined after the elimination of spelling variants and name harmonisation.
The maturity of a technology may also be influenced by other factors, such as the percentage of university filings, which are typically higher at the inception phase when more breakthrough inventions are seen compared to later phases, when companies focus instead on improving processes or consumer-oriented inventions. Also, links to other data from related products, markets, substitute technology and trade-mark activity may be important to complement the picture of the life cycle of a given technology.
In conclusion, we find that the maturity map can be a helpful tool for assessing technological developments by identifying phases of growth or stagnation of patent filings, as well as any consolidation or diversification of applicants. The findings can be complemented by data from other sources.
Keywords: Patent insight reports, international patent families, offshore wind energy, technology life cycle, maturity map, S-curve