Key patenting trends
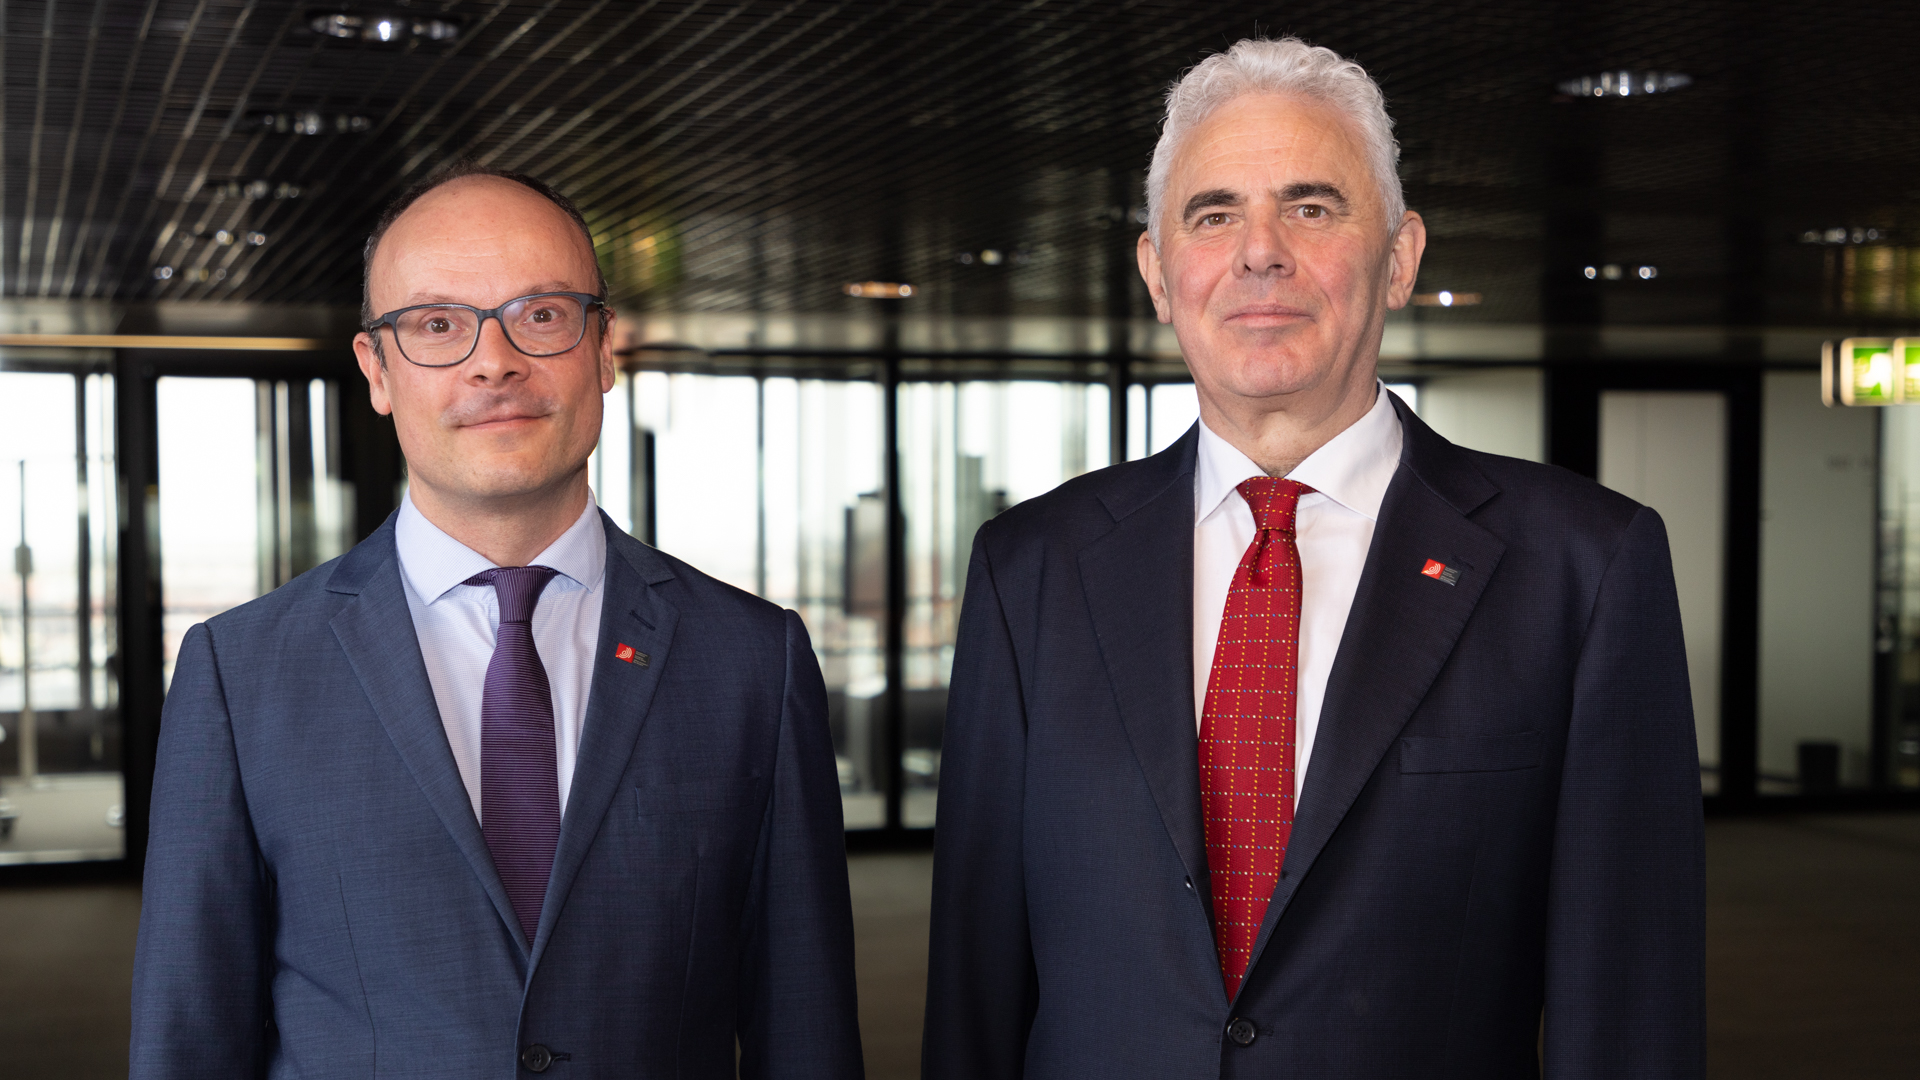
Yann Ménière, EPO Chief Economist (left), and Aidan Kendrick, EPO Chief Business Analyst, discuss the key patenting trends at the EPO in 2023. Increasing demand (+2.9%) for European patents has been mostly driven by applicants from China and Korea. Many digital technology fields show strong growth, including in batteries and artificial intelligence, whilst patent filings in some areas of chemistry and mechanical engineering continue to stagnate or decline.
Aidan Kendrick, EPO Chief Business Analyst
Patent applications to the European Patent Office in 2023 were up almost three percent, to over 199 000 filings – a new record.

Figure 1 Five-year headline trend for all filings to the EPO
Patent applications from European entities increased by 1.8% last year, and from US applicants by far less. Growth in filings to the EPO in 2023, therefore, has been driven by applicants from China and Korea. The attractiveness of Europe’s technology market is reflected in the steady growth in the share of filings to the EPO from outside Europe. Filing volumes by applicants from China are approaching parity with those from Japan.
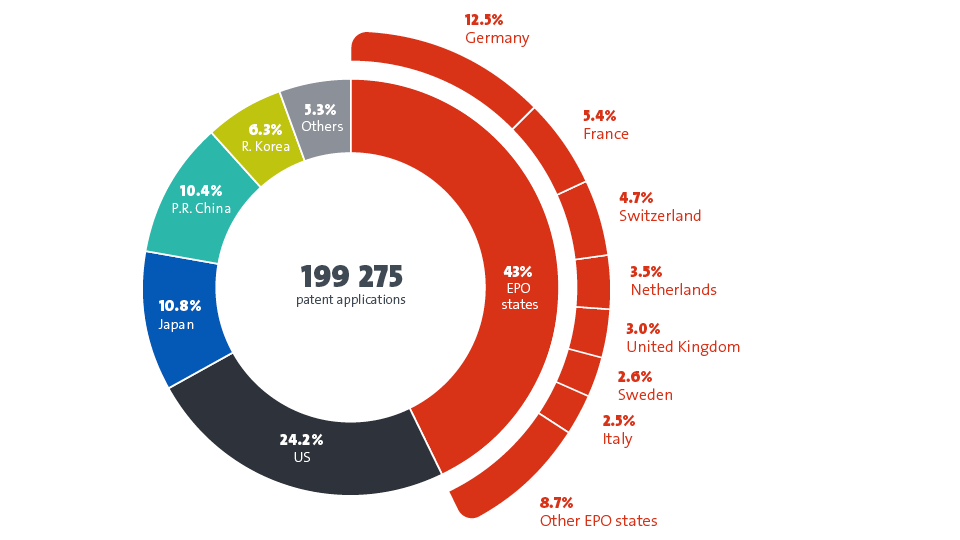
Figure 2 Origin of European patent applications 2023
Growth in filings from European companies, startups, universities and public research organisations was generally positive, but with significant variations between countries. Major growth last year was posted by applicants from Finland (+9.2%), Italy (+3.8%), the Netherlands (+3.5%), Spain (+6.9%) and the United Kingdom (+4.2%).
It is good to see that German applicants, our biggest source of filings from amongst our member states, returned to growth last year (+1.4%). Modest increases were also seen from e.g. Sweden (+2.0%) and Switzerland (+2.7%). Only a few of the leading countries posted a small decrease in applications, e.g. Austria (-1.1%), Belgium (-2.2%), Denmark (-3.3%) and France (-1.5%).
Granted patents and uptake of the new Unitary Patent
Timely processing of patent applications is important for inventors, businesses, investors and the public. This is why we were pleased to see the result of more examination work, with over 104 600 granted patents issued in 2023.
More exciting for us has been the popularity of the new Unitary Patent, introduced last June, which is reducing costs and complexity for proprietors of newly granted European patents. Of the patents we granted in 2023, some 17.5% requested unitary effect, a single validation covering 17 EU member states. Uptake from patentees based in Europe was even higher, at 25.8%, comprising almost two thirds of all Unitary Patents.
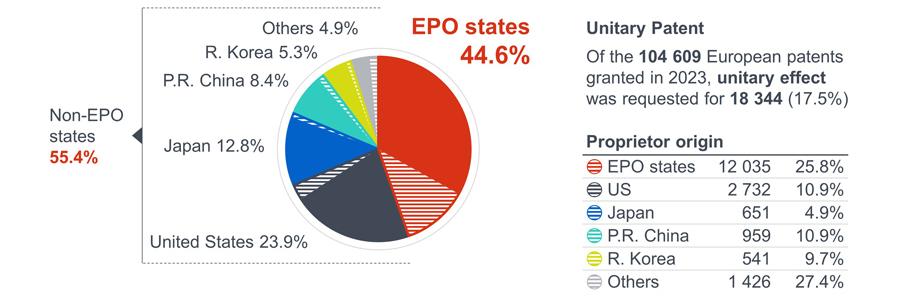
Figure 3 Granted patents and Unitary Patents in 2023
Yann Ménière, EPO Chief Economist
Patenting in digital and electrical technologies saw continued growth in 2023.
The top technology field was digital communications yet again – with over 17 700 applications, up 8.6%. But the biggest growth of all, driven in part by innovation in batteries, was seen in electrical machinery, apparatus and energy, up 12.2% with over 15 300 filings.
Biotechnology – used in medical science or agriculture, for example – grew by 5.9%. In the last couple of years this field has posted stronger growth than many other areas of healthcare or chemistry.

Figure 4 The Top ten technology fields (out of a total of 35) accounted for over 57% of all filings to the EPO in 2023
Women’s inventive activity
Towards the end of 2022 the EPO published its first study reporting on women’s participation in inventive activity. Over the last four decades the proportion of patent applications naming at least one woman as an inventor has risen from 4% to 23% - still a long way short of parity. Taking our study as a baseline, we have continued to track this rate in 2023.
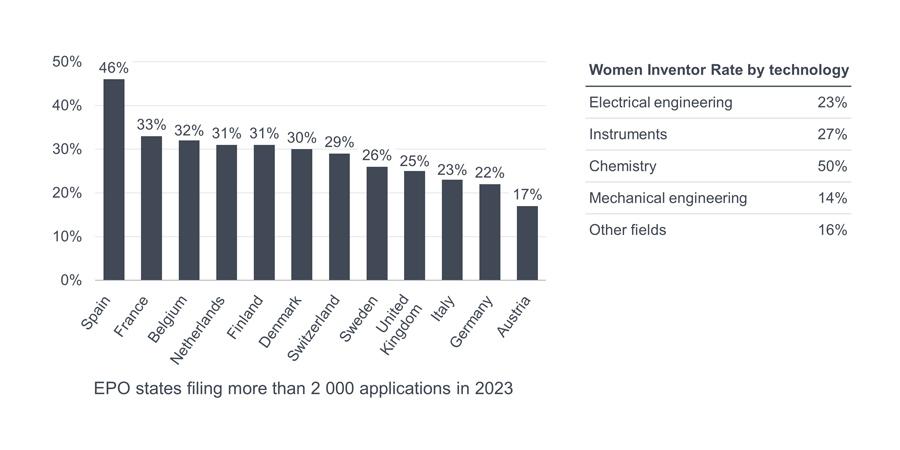
Figure 5 Women Inventor Rate 2023 – the proportion of applications to the EPO from applicants based in an EPO member state naming at least one woman as an inventor
When we consider only European applicants, we see wide variations in the Women Inventor Rate between countries. Large differences are also seen between technologies, with the Women Inventor Rate for biotechnology or pharmaceuticals three times that for electrical machinery, apparatus and energy, for example. These results show more can be done to encourage girls to study science and engineering, as well as to foster more women in such careers.
Top applicants in 2023
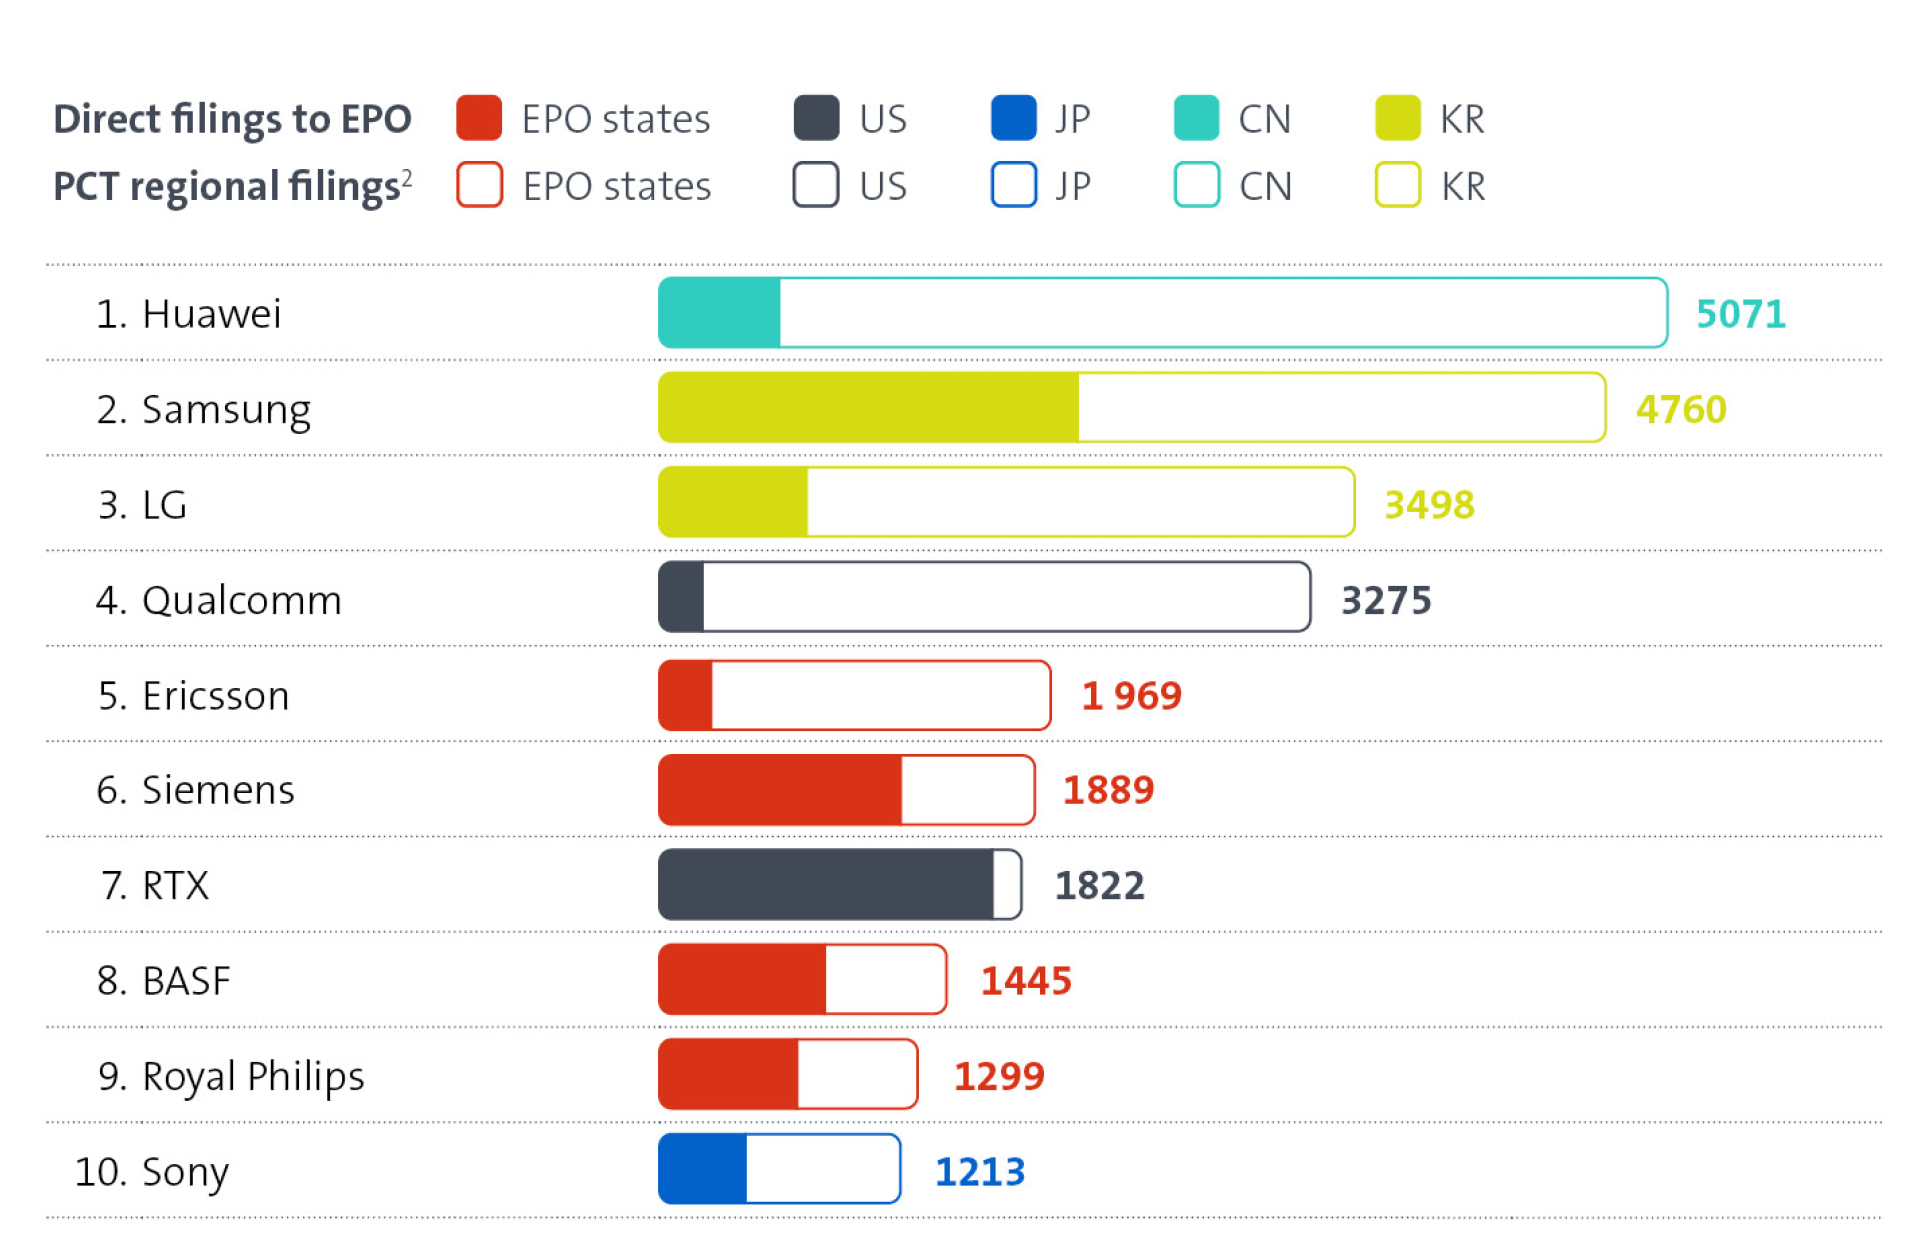
Figure 6 Top applicants to the EPO in 2023, with breakdown for direct filings and those submitted via the PCT.
The top ten applicants contributed almost 13.2% of all filings to the EPO in 2023. Amongst the largest applicants for European patents, four of the top ten companies are European - Royal Philips, BASF, Siemens and Ericsson. They are joined from Japan by Sony; from the US by RTX (formerly Raytheon Technologies) and Qualcomm. In third and second place are LG and Samsung, who contributed almost two thirds of all filings from the Republic of Korea. In first place yet again was Huawei, who were responsible for almost a quarter of all filings to the EPO from China last year.
